1. Introduction
In the world of visual communication, infographics and presentations play a vital role in delivering information in a captivating and engaging manner. Piktochart is an online design platform that empowers individuals, businesses, and educators to create stunning infographics and presentations with ease. In this article, we will explore what Piktochart is, its key features, how to create infographics and presentations using the platform, the benefits it offers, and the support available to users.
2. What is Piktochart?
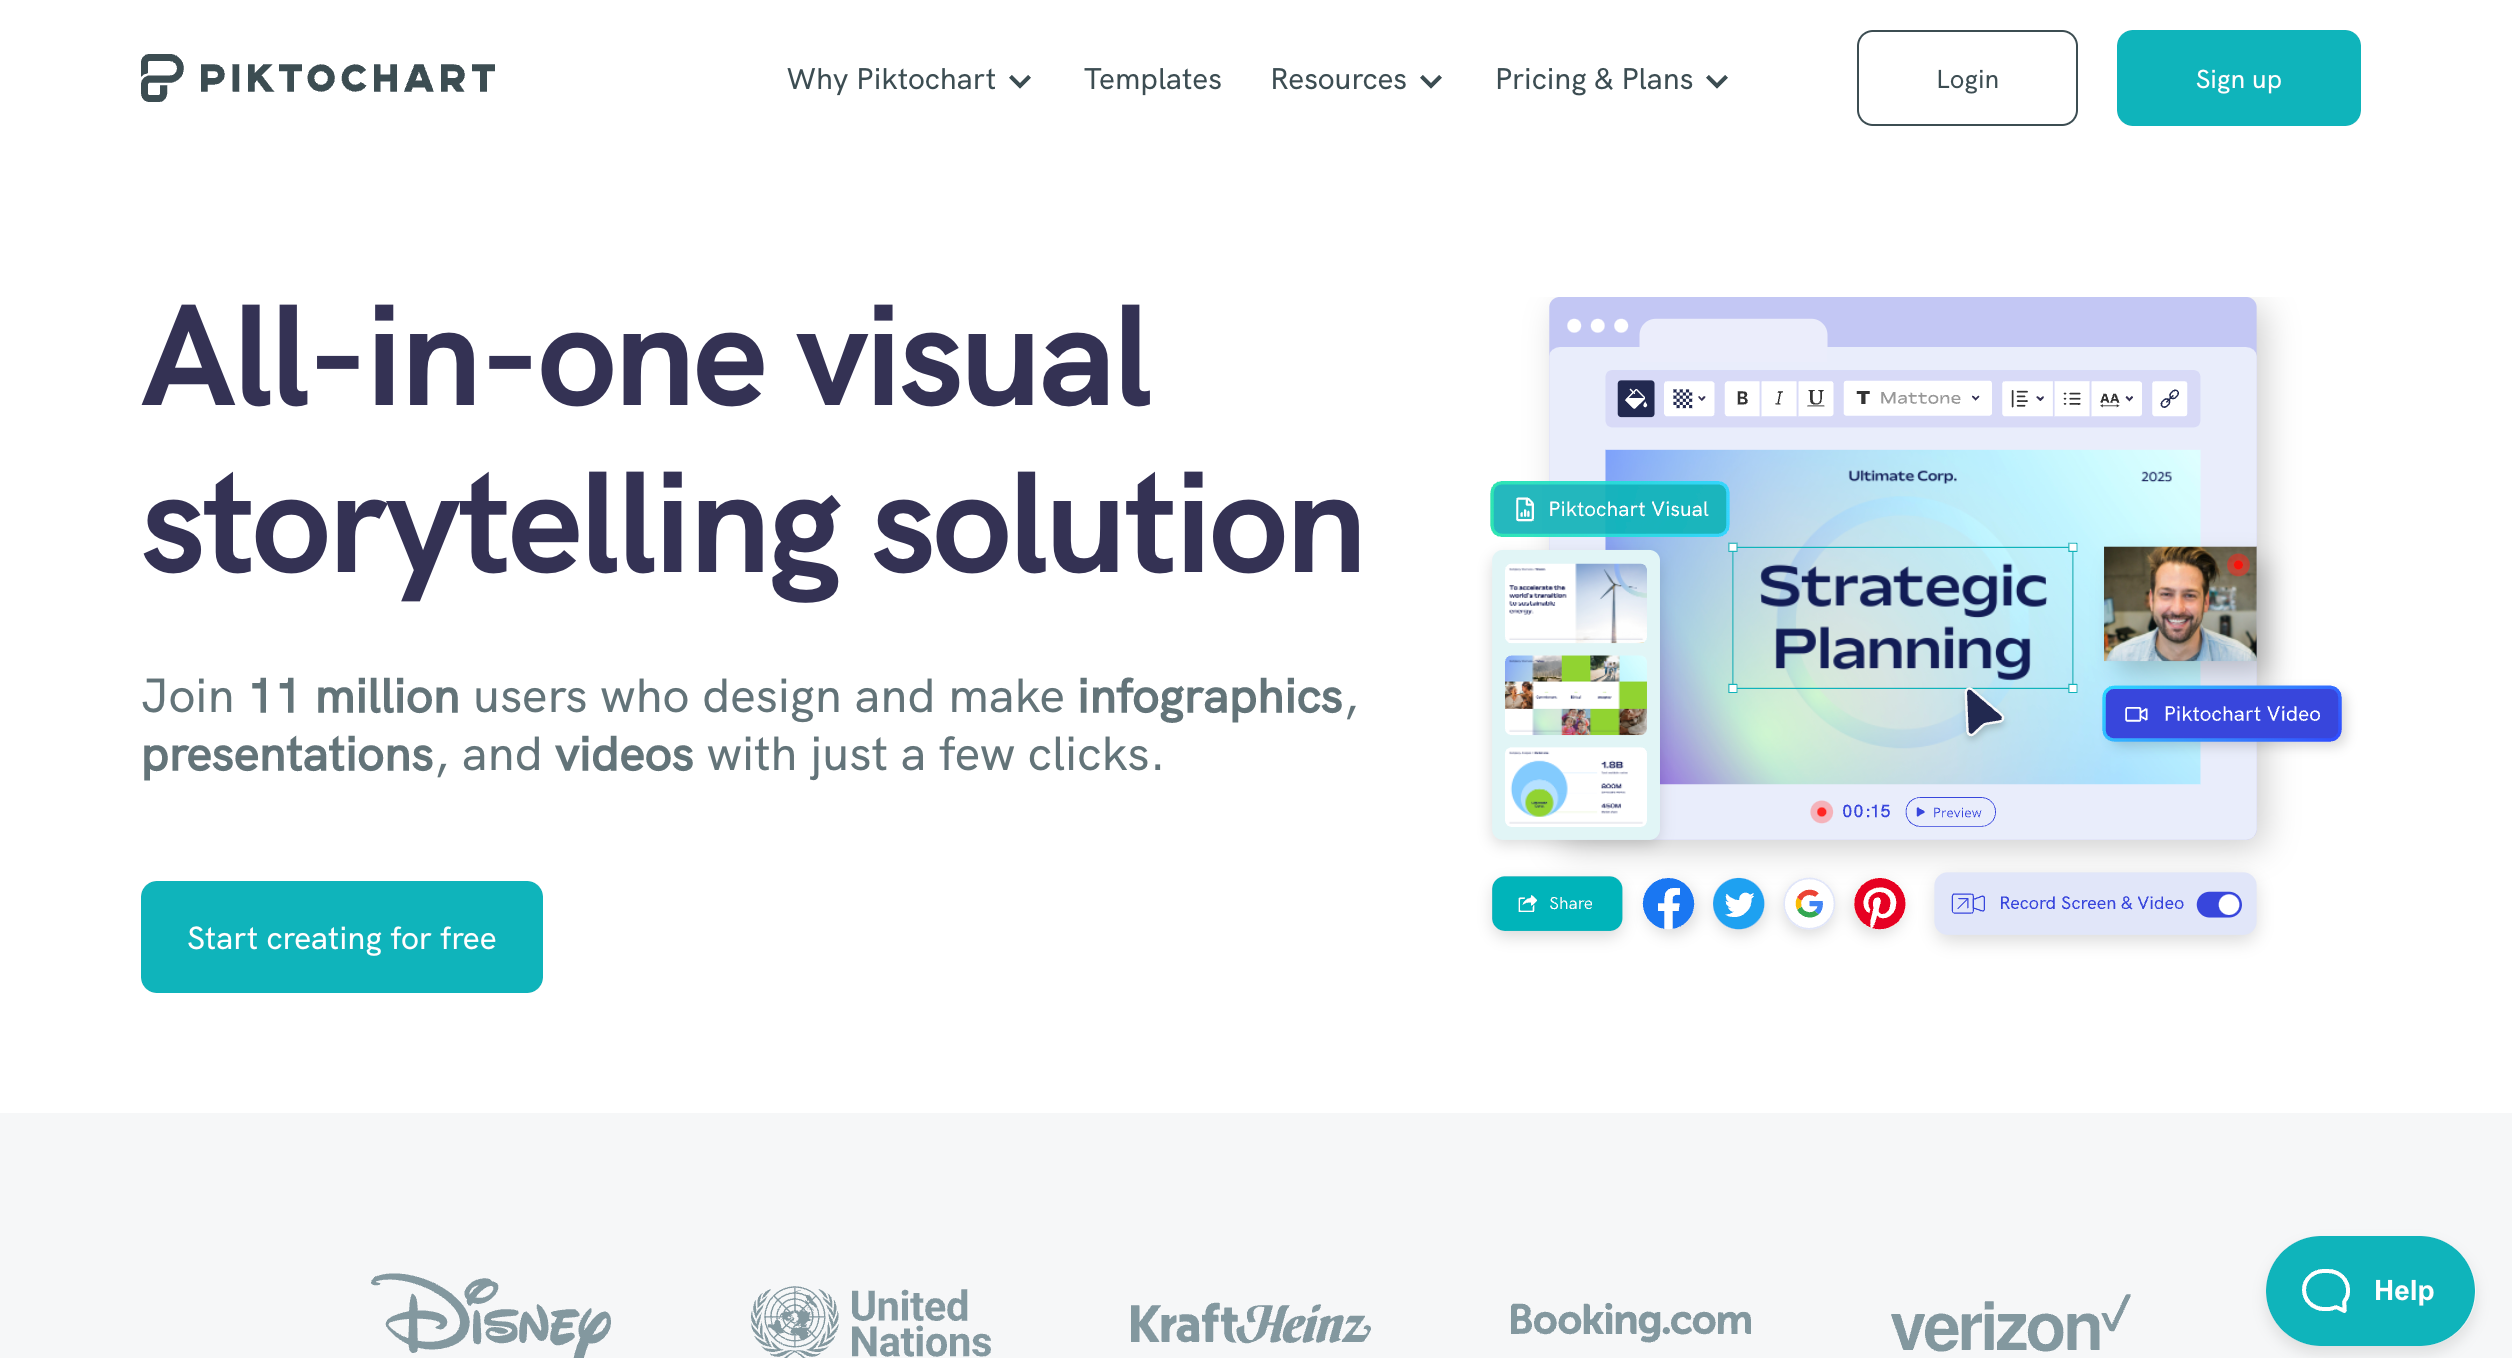
Piktochart is an intuitive online design platform that allows users to create professional-looking infographics, presentations, reports, and posters without the need for graphic design skills. With its user-friendly interface and a wide range of customizable templates, Piktochart makes it easy for anyone to visualize complex information and present it in a visually appealing way.
3. Key Features of Piktochart
Piktochart offers a range of features that simplify the design process and enhance the visual appeal of infographics and presentations:
- Customizable Templates: Piktochart provides a vast library of customizable templates for infographics, presentations, reports, and posters. These templates serve as a foundation for design projects, allowing users to save time and focus on content creation.
- Drag-and-Drop Interface: Piktochart’s drag-and-drop interface makes it easy to add and arrange elements such as text, images, icons, and charts on the canvas, enabling users to create visually appealing layouts effortlessly.
- Data Visualization: Piktochart offers a variety of charts, graphs, and maps that can be easily integrated into infographics and presentations. Users can input their data, and Piktochart automatically generates visually appealing and interactive visualizations.
- Image Library: Piktochart provides access to an extensive library of high-quality images, icons, and illustrations. Users can search and select relevant visuals to enhance the design of their infographics and presentations.
- Customizable Color Schemes and Fonts: Piktochart allows users to customize color schemes, fonts, and styles to match their brand or personal preferences, ensuring visual consistency and enhancing the overall design aesthetic.
- Embed Media and Hyperlinks: Piktochart enables users to embed videos, audio files, and hyperlinks within infographics and presentations, creating interactive and engaging experiences for viewers.
- Collaboration and Sharing: Piktochart supports collaboration by allowing users to invite team members to collaborate on design projects. Users can also easily share their creations via email, social media, or by embedding them on websites or blogs.
4. Creating Infographics and Presentations with Piktochart
Creating infographics and presentations with Piktochart is a user-friendly process. Here’s a step-by-step guide to help you get started:
Step 1: Choose a Template
- Browse through Piktochart’s template library and select a template that suits the purpose and style of your infographic or presentation.
Step 2: Customize the Design
- Use Piktochart’s intuitive drag-and-drop editor to add and arrange elements such as text, images, icons, and charts on the canvas.
- Customize the colors, fonts, and styles to match your branding or design preferences.
- Incorporate data visualizations by inputting your data into charts, graphs, or maps, and customize their appearance.
Step 3: Enhance with Visuals and Media
- Utilize Piktochart’s image library to search and select relevant visuals, icons, and illustrations to enhance the visual appeal of your design.
- Embed videos, audio files, or hyperlinks to create interactive elements within your infographics or presentations.
Step 4: Preview and Export
- Preview your design to ensure that everything looks as desired and is visually appealing.
- Once satisfied, export your infographic or presentation in your preferred format, such as PNG, PDF, or HTML.
- Share your creations by directly downloading them or by sharing links, embedding them on websites or blogs, or posting them on social media platforms.

5. Benefits of Using Piktochart
Using Piktochart for infographic and presentation design offers several advantages:
- User-Friendly Interface: Piktochart’s intuitive interface and drag-and-drop functionality make it accessible to users with varying levels of design experience, allowing them to create professional-looking visual content effortlessly.
- Time Savings: Piktochart’s customizable templates, pre-designed elements, and easy editing tools save time in the design process, enabling users to focus on crafting compelling content.
- Visual Appeal: Piktochart’s wide range of design options, customizable color schemes, and high-quality visuals help create visually appealing infographics and presentations that captivate audiences.
- Data Visualization: Piktochart’s data visualization tools make it easy to transform complex data into visually appealing charts, graphs, and maps, helping viewers grasp information quickly and easily.
- Brand Consistency: Piktochart allows users to customize colors, fonts, and styles to match their branding, ensuring visual consistency across all design materials.
- Collaboration and Sharing: Piktochart’s collaboration features enable team members to work together on design projects, fostering creativity and streamlining the design process. Sharing options make it easy to distribute and showcase infographics and presentations across various platforms.
6. Pricing Plans and Options
Piktochart offers different pricing plans to accommodate various user needs. These plans include free and subscription-based options, each with its own set of features, benefits, and limitations. It is recommended to visit the Piktochart website for detailed information on the available plans and pricing.
7. Support and Resources
Piktochart provides support and resources to assist users throughout the design process:
- Help Center and Tutorials: Piktochart’s Help Center offers a comprehensive knowledge base with articles, guides, and tutorials to help users navigate the platform’s features effectively and learn design best practices.
- Community and Forums: Users can engage with the Piktochart community and forums to seek advice, share tips and tricks, and find design inspiration.
- Customer Support: Piktochart offers customer support to address specific inquiries, technical issues, or concerns raised by users.
8. Conclusion
Piktochart is a powerful online design platform that empowers users to create visually stunning infographics and presentations. With its user-friendly interface, customizable templates, and versatile design features, Piktochart provides a valuable resource for individuals, businesses, and educators looking to communicate information effectively through compelling visual content.


